Paraphrasing the seminal 2015 paper: Machine Learning is amazingly useful to create complex systems fast, but those quick wins come with a hidden price tag. It can be difficult to take trained models and plug them into production environments; you have a variety of issues to deal with: Configurations, data (collection, verification, enrichment, and feature extraction), infrastructure management, performance monitoring, and analyses. The list goes on.
New problems create new solutions: Machine Learning Operations (also known as MLOps) started as a set of best practices concerning the ML lifecycle, which evolved into a variety of automation tools and platforms. Similar to the umbrella terms DevOps and DataOps, MLOps encapsulates a large number of overlapping responsibilities: data versioning, data preparation, model training, model deployment, model performance monitoring, and more. Unfortunately, no single tool or platform can provide an answer to all these issues. Yet.
This post is the first piece in a series dedicated to showcasing some of the best practices concerning MLOps in an organization with an active Data Science / Machine Learning team.
Experiment Tracking
The first item on our list is not the first phase (chronologically) in the ML Lifecycle. Still, it’s usually neglected in many teams: Efficient tracking of experiments and models trained across the team.
ML research teams often grow organically, and the tooling doesn’t evolve at the same speed. Experiment tracking is often ‘temporarily’ covered by a shared spreadsheet, and that temporary solution is used over a long period. Every experiment needs to be manually written in, along with (optimally) data versioning, code versioning, algorithm hyperparameters, and the outputs of the selected metrics. Because of the manual nature of such methods, it’s not uncommon to find that these spreadsheets are not up to date or to find missing parameters or metrics.
Centralized Experiment Tracking with MLFlow
MLFlow, an open-source MLOps platform, houses the ability to efficiently track your experimentation directly from the code or notebooks you use to train the models (among other features). The real beauty of this platform is the API: allowing access directly from your code (Python, R, Java) or via a REST API. Check out the Python code sample below to see how easily an experiment can be tracked:
Notice that you can log any number of parameters and metrics that you want, as shown above.
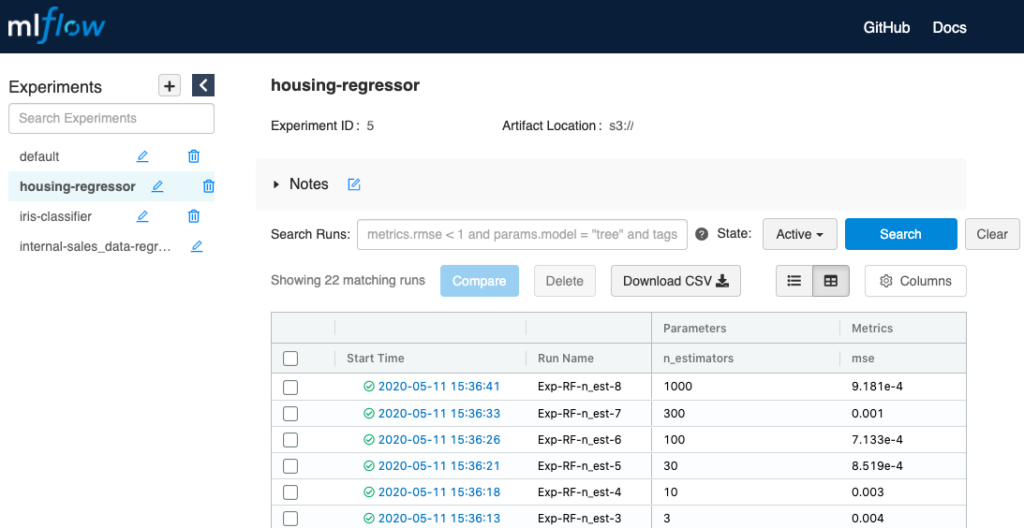
After running a few of these experiments, you might want to go over to the MLFlow UI and look at your results in a centralized location. Maybe you also have other team members trying different strategies with the same data. As long as you all were using the same experiment name (MLFlow’s name for the project), all the results will be documented in the same table:

You can also use the search bar to filter out relevant runs by specific parameters or metric scores. Additionally, you can use one of the auto-logging-supported packages (Tensorflow, Keras, Gluon, XGBoost, LightGBM, and Spark at the time of writing) to get more bang for your buck. Check out the automatic logging docs page for more information.
Setting up an MLFlow Server on AWS: Step-by-step
The collaboration perks of using any centralized experiment tracking platform are great, but MLFlow is especially easy to set up and has almost no operational costs on AWS. How? Well, the server itself isn’t required to perform any heavy lifting, so we can use free-tier resources (EC2 and RDS) to set it up. The process takes less than 10 minutes to set up on your AWS account:
-
-
-
- Spin up a new EC2 instance (Amazon Linux 2 AMI, free-tier t2.micro). Make sure you generate an SSH key-pair, and the security group settings allow access via SSH and port 5000 (the UI default port).
- Spin up a new free-tier PostgreSQL RDS. Call it ‘mlflow-rds’ or a similar name, and type in your desired password. Make sure the networking settings are compatible with the EC2 network settings and name your initial DB name ‘mlflow’ or a similar name.
- Create a new S3 bucket, which will be the storage bucket for our MLFlow server. Name it an appropriate yourorganisation.mlflow.data or a similar name.
- Create a new EC2 Service Role and add the relevant S3/RDS permissions to that role.
- Once all your resources have been created, SSH into the EC2 and run the following commands:
-
- 6. Connect to your newly created MLFlow UI by accessing the EC2 public end-point via port 5000 in your browser.
- 7. For easier CLI usage, set your local environment variable of MLFLOW_TRACKING_URI to https://EC2-ENDPOINT-URL:5000.
Note: Except VPC and Security Group settings you may have added, this is an unsecured setup and is not production-ready! There is a large body of documentation and resources available to assist with adding additional layers of security to this setup.
From this point, you can use MLFlow to automatically track your ML experiments, as shown above.
If you followed along and installed an MLFlow server on your AWS environment or just on your local machine, I highly recommend going over to the official MLFlow documentation for more advanced tutorials and API references. As you may have noticed, MLFlow has more modules alongside tracking – we have only started to scratch the surface in this short post.
The Bottom Line
If you have an active Data Science research team in your organization, but your experiment management tooling is lacking, consider using MLFlow as an open-source MLOps platform. It’s lightweight, barely has any operational costs when installed on AWS, and is easy to integrate with your current notebooks and codebase. AllCloud’s data professionals can help you optimize your Machine Learning journey with MLFlow on AWS, and reduce the overhead required for successful research collaboration. Contact us to learn more!
-