In our conversations across industries, a common theme emerges when we talk about putting data to work. Business leaders understand the idea as a concept, but they sometimes struggle to see the practical applications of their data and how it can move their business forward. In our work in the consumer goods space, there are clear areas where data can be put to use, made actionable, and lead to significant impact on the bottom line of a business.
- Visibility into Inventory Levels
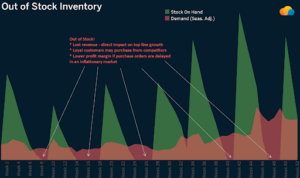
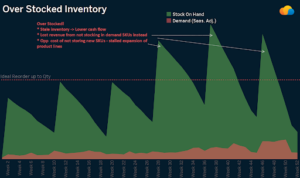
The past 2 years have been a great (and frightening) eye opener when it comes to the challenges associated with supply chain and fulfillment. Having visibility into inventory levels helps drive action – and prepare for uncertainty. By understanding real-time inventory levels, companies are able to preorder products as needed to account for what is now a potentially long lead time (6-9 months). When calculating the true value of understanding inventory, it’s important to consider the multiplier effect of a consumer not being able to find what they need from you. One simple “out of stock” message on a website has the potential to not only represent the lost revenue of that sale but also that consumer’s future sales and ultimately their loyalty to your brand.
Some sample visualizations that can showcase the power of Tableau’s visual analytics.
- Prevent Customer Churn
By leveraging data within your CRM, we’re able to look at analytics of when a customer is at the risk of churn and add measures to help ensure they stay a customer. By identifying the indicators within your data, we can build systems of intervention (e.g. a prompt for a CSR to offer a coupon) to keep customers happy – and ultimately keep them as customers.
Fast, interactive visualizations built in Tableau can be embedded directly into your operational applications (e.g. OMS or CRM) where the end user has quick and easy access to analytics about the customer where they need it. These capabilities can really help empower your customer facing employees with holistic information about the customer – and encompass multiple systems outside just their primary operational application that they interact with.
- Fast and Easy Connectivity to your CG Applications and Data Stores
One of the keys to implementing impactful analytics is the ability to bring multiple sources of siloed data together and marry them to uncover hidden patterns about the business. With the support to read data from hundreds of data sources and applications, Tableau enables you to do just this. Data from leading Consumer Goods industry vendors and applications such as Salesforce, SAP, Microsoft, Oracle and Adobe are all available for quick and easy access via Tableau with just a few clicks. This ease of secure access to data can help bypass IT bureaucracy and provide a head start to your Data team who is responsible for implementing the analytics for your business. Once multiple sources of data are connected within Tableau, you can blend these data sources based on any common fields available (e.g. Customer ID from your CRM and OMS) to start your analysis right away. If your business already has a Data Warehouse where internal application data is housed, Tableau supports connectivity to almost all the DW platforms like Snowflake, Amazon Redshift, Azure Synapse, Google BigQuery, etc.
Data isn’t just a vehicle for better understanding your business – it’s a way for you to propel it forward. We can help.
Contact us today to learn more and get started.